Overview of the Sales Dashboard
The Sales Dashboard consists of three tabs that display your sales data in multiple easy-to-read graphs. The Sales Summary tab focuses on your overall sales and includes six mini-views to help break down the data. See Viewing a Summary of Sales for additional information. The Sales by Product tab focuses on sales based on inventory and the Sales by Customer tab concentrates on sales specific to customers. For information on these tabs, see Viewing Sales by Product and Viewing Sales by Customer. Together, the tabs provide a complete picture of your sales data.
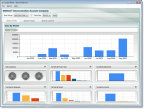
Click thumbnail to view larger image.
Published date: 10/23/2019