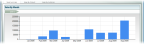
Sales by <Data Size>
This is the main view on the Sales Summary tab. The following data levels are available:
• The Level 1 view displays a column graph which indicates the sales revenue based on the selected date and data size. Each column represents a unit within the selected data size. For example, if you are viewing data by Month, each column represents one month. You can drill down to the Level 2 view by clicking a column in the graph.
• The Level 2 view displays the sales revenue for the selected column broken down by Salesperson Code. You can drill down to the Level 3 view by clicking a column in the graph or return to the Level 1 view by selecting the Level 1 indicator above the graph.
• The Level 3 view brings up the Sales History Report, which shows the sales for the selected Salesperson Code and date range. You can print the report or export it to an external file. See Printing and Exporting Data for more information.
Click image for larger view.
If you hover over a box at the Level 1 or 2 views, a pie chart appears that shows the following information:
• Cost of goods sold: <beginning inventory + purchases - ending inventory>
• Profit margin: <% - net profit divided by revenue multiplied by 100>
• Total sales amount: <total sales amount for the selected date range>
• Time frame: <start date> - <end date> (Level 1) / Salesperson Code (Level 2)
Additionally, you can hover over the legend at the Level 2 view to see the Salesperson Code and Salesperson description.
Published date: 10/23/2019