Viewing Budgets
If you have budgets set up in your software, you can view your account data compared to your budget in any data view of the Financial Dashboard (data size must be a month or greater). This gives you a visual representation of your company’s performance in relation to your pre-defined budgets for any data appearing in the view, including data from the compare feature (see Comparing Data). To access the budget feature, right-click in the data view for which you want to see budget amounts and select Show Budget.
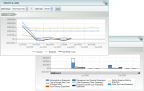
On line graphs, the budget appears as a dotted line the same color as the account it is paired with. On column graphs, a black outline appears over the account it’s paired with.
Click thumbnail to view larger image.
You can view specific information about the budget by mousing over the budget line. This tooltip includes the actual total, the budget total, the dollar variance, and the percentage left. You cannot drill down on budget data; if you click on a budget column, the next level of data or the report that appears is actually the data for the account that the budget is tied to.
For information on how to set up budgets in your software, see the user’s guide or online help that came with your accounting package. For information on how budget information appears for the different data size options, see Budget Data in Cougar Dtails.
Published date: 10/23/2019