Analytics
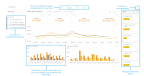
The Analytics page is where you access your dashboards. Dashboards are made up of widgets that you can individually design (if you have design rights), filter, and download. You can view dashboards you design or that are shared with you. When you make local changes on a shared dashboard, the changes only affect your copy. When the dashboard is republished, the updated version will override the changes you made.
Click thumbnail to view larger image.
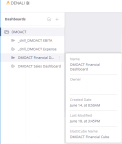
All of the dashboards available to you appear on the left side of the Analytics page. Hover over any dashboard name to view its details, such as the owner, when it was created, and when it was last modified. When you hover over a dashboard name you will also see an options menu icon to the right of the name. Click the icon to view the options available.
Click thumbnail to view larger image.
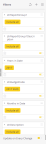
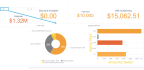
Using the Filters column on the right, you can filter all the widgets in your dashboard at once. For example, you can look at certain dates or a certain revenue type. You can also filter widgets by clicking a portion of a widget (a bar in a bar chart, for example) or click and drag to select a range. You can use multiple levels of filters to narrow the data down to exactly what you need to see and then remove or change the filters at any time.
Click thumbnail to view larger image.
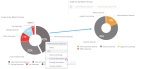
In most widgets, you can drill-down into the data. For example, you can right-click on a slice of a pie chart or a bar in a graph to see your drill-down options. Use the breadcrumbs in the top left of the widget to move to a higher level of your drill-down or click the X to close the drill-down.
Click thumbnail to view larger image.
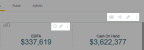
You can also drill down in some indicator widgets. Indicator widgets have a number or gauge that shows a specific value. These widget types will have a jump symbol in the top left corner to let you know they have a drill down available.
Click thumbnail to view larger image.
If you need to view any of this data outside of Denali BI powered by Sisense, you can download the entire dashboard or a single widget as an image or PDF. You can also choose to print a PDF of the dashboard or a widget. To print a PDF, click the PDF button at the top of the dashboard. To download, click the options menu in the top right corner of the dashboard or widget.
Click thumbnail to view larger image.
For more information, see Dashboards.
Published date: 10/23/2019