Mini-Views
Mini-views are quick ways to view your data. They appear in the bottom half of the Sales Summary tab and show a visual representation of your sales data for product, department, salesperson, location, vendor, and comparison to quota.
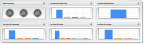
Click image for larger view.
Some common features of the mini-views are:
• You can click on the expand icon in the right-hand corner to expand the view to show a grid with the specific entries that make up the graph.
• When one view is expanded, the other views appear as one of five expandable columns along the right-hand side of the bottom half of the window. The expandable columns show only the average sales information for all mini-views except the Sales Comparison view, which shows the sales quota met for Gauge 1.
• When expanded, you can select the Sales column heading to change the sort order from descending to ascending. When you do this, you will see the bottom sales for the selected mini-view rather than the top sales.
• When expanded, you can click on a grid item to change the graph to show the sales based on only the selected item. For example, if you’re viewing sales by top salespeople, you can click on a specific salesperson in the grid to see his data.
• You can drill down on the column graph in any expanded view to the Sales History Report for the selected data.
• To show all six mini-views, you can click on the minimize icon in the right-hand corner of an expanded view.
• When minimized, the views show a maximum of the top ten regardless of the ranking limit set in the Sales Dashboard Preferences.
• You can drag and drop mini-views within the lower part of the tab to change their order.
Published date: 10/23/2019