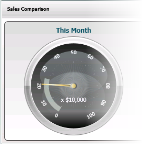
Sales Comparison
This view includes three gauges, each with a different time frame and sales quota that you define in the Sales Dashboard Preferences window. See Sales Dashboard Preferences for more information on the gauges and setting your preferences.
Each gauge has the following features:
• The marks on the gauge increment in 10% intervals from 0-100.
• The gray column that appears on the gauge represents the sales quota (benchmark) value.
• The number in the center of the gauge is the scale multiplier. For example, if your benchmark is set to 80,000, the center text reads x10,000 and each mark represents 1,000.
• The needle of each gauge represents the total sales based on the time frame you selected. If a value is negative, the needle will remain at zero.
If you mouse over a gauge in either the collapsed or expanded view, a tooltip appears with the following information:
• Time frame: <start date> - <end date>
• Actual total sales: $ <total>
• Sales quota: $ <benchmark value from Sales Preferences>
• Quota % met: $ <% difference between total sales and quota>
For example, if your comparison value is set to Month and your sales quota is 250,000, your gauge would look like the following figure if you have 205,000 in sales for the month.
Click image for larger view.
Published date: 10/23/2019