Performance Indicators
The options you select for the performance indicators affect how the gauges display your sales data in the Sales Comparison mini-view on the Sales Summary tab.
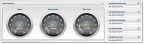
Click thumbnail to view larger image.
Comparison Value
Select a date range from the drop-down for each gauge. You can define the comparison value for each of the three gauges to display data for the Year, Quarter, Period, Month, Week, or Day. See Data Size Options for an explanation of these options. For additional information on the gauges, see Sales Comparison.
Sales Quota
Type the sales quota for each gauge to set your benchmark value for the selected time period. The gray bar on the gauges represents the values you enter in these fields. For more information, see Sales Comparison.
Use System Date
Select this check box to use your computer’s system date as the starting date for the gauges. For example, if your system date is 8/16/10 and you select this check box, the Today gauge uses 8/16/2010 as the date. This check box will override the Date Range entered on the Sales Summary tab. If you leave this unchecked, the system will use the last day of the Date Range entered on the Sales Summary tab.
Published date: 10/23/2019