Viewing Cash Flow Data
The data that appears is based on data that you see on your Cash Flow Statement. The groups and accounts that appear in the different view levels are set up in the GL Master Accounts window. You can view different levels of data by clicking in the view on the account or group you want to drill down into.
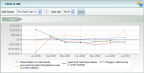
Click thumbnail to view larger image.
The following data levels are available:
• Level 1, by default, displays Accounts/Vouchers Payable/Accruals (Current Liability) on one line, Receivables (Current Assets) on a second line, net change in Cash and Cash Equivalents on a third line, and Change in Net Income (Excess Revenues over Expenses in Fund) on the fourth line. You can also see Depreciation Expense (Expenses), Gain/Loss Sales of Assets (Revenues and Gains), Provisions for Doubtful Accounts (Expenses), Inventories (Current Asset), Prepaids/Deferred Expenses (Other Asset), Purchases Fixed Assets (Fixed Asset), Gain Sale Marketable Securities (Revenues and Gains), Other Investing Activities (Non-Current Asset), Long Term Debt-net (Long Term Liability), Other Financing Activities (Long Term Liability), and No group selected. Click the gears button to open the Account Grouping Tree View window to select the account types you want to view (see Selecting Which Accounts to Include). This level breaks down the data based on the Group 1 Report Groups in General Ledger. You can drill down to the Level 2 view by clicking a line in the graph (the Change in Net Income line is not available for drill-down).
• The Level 2 view shows a column graph of each account that makes up the report group you selected. You can see how each account within the group performed within the date range. You can drill down to the Level 3 view by clicking a column in the graph, or return to the Level 1 view by selecting the Level 1 indicator above the graph.
• The Level 3 view opens a new window displaying a transaction report for the selected account. This view shows the transaction information that you would see on the GL Audit Trail report. It uses the date range you selected in this view and sorts the data by transaction date. If you are using CMS Professional, please note that the Post Date column will appear blank for transactions posted prior to CMS Professional version 12. If you are using Denali, the Post Date column will not appear.
If at any time you want to customize exactly which accounts or groups appear in view, click the account or group title in the legend. This opens the Account Grouping Tree View window filtered to show only the selected account or group. You can also click the gears button in the top, right-hand corner of the view (see Selecting Which Accounts to Include).
For more ways to view data, see Comparing Data, Viewing Budgets, and Looking at a Shorter Time Frame.
Published date: 10/23/2019