Viewing Revenue & Expense Data
The Revenue & Expense view appears for Fund users (regular Accounting users see Viewing Profit & Loss Data). The data that appears is based on data that you see on your Revenue and Expense Statement. The groups and accounts that appear in the different view levels are set up in the GL Master Accounts window.
Click thumbnail to view larger image.
You can view different levels of data by clicking in the view on the account or group you want to drill down into. The following data levels are available:
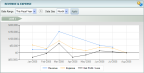
• The Level 1 view is the default view and it indicates the totals for revenue on one line, expense on a second line, and excess revenue over expense on a third line. This is the broadest view of your data, but you can drill down to increasingly more specific views. These are accounts that are defined in General Ledger as Revenue (Operating Credit), Revenue Adjustment, Expense (Operating Debit), and Expense Adjustment. You can drill down to the Level 2 view by clicking either the Revenue or Expense line in the graph.
• The Level 2 view shows a column graph of the groups that comprise your revenue or expense accounts. This level breaks down the data based on the Group 1 Report Groups. You can see how each group performed within the date range. You can drill down to the Level 3 view by clicking a column in the graph, or return to the Level 1 view by selecting the Level 1 indicator above the graph.
• The Level 3 view shows a column graph of each account that makes up the report group you selected. You can see how each account within the group performed within the date range. You can drill down to the Level 4 view by clicking a column in the graph, or return to the Level 1 or Level 2 views by selecting the respective Level indicator above the graph.
• The Level 4 view opens a new window displaying a transaction report for the selected account. This view shows the transaction information that you would see on the GL Audit Trail report. It uses the date range you selected in this view and sorts the data by transaction date. If you are using CMS Professional, please note that the Post Date column will appear blank for transactions posted prior to CMS Professional version 12.If you are using Denali, the Post Date column will not appear.
If at any time you want to customize exactly which accounts or groups appear in view, click the account or group title in the legend. This opens the Account Grouping Tree View window filtered to show only the selected account or group. You can also click the gears button in the top, right-hand corner of the view (see Selecting Which Accounts to Include).
For more ways to view data, see Comparing Data, Viewing Budgets, and Looking at a Shorter Time Frame.
Published date: 10/23/2019